Correction: this article originally said the data was released in August, but it was actually released in late July. We apologize for this error.
In July, the Asheville Police Department released their quarterly "Use of Force" data, which is available to view in a simple tabular format via the city's open data portal. As part of an ongoing project that we at the Asheville Free Press hope will help put this data into perspective and make it more accessible and actionable for our community, our Data Editor, Elliot Patterson, has created two interactive visualizations.
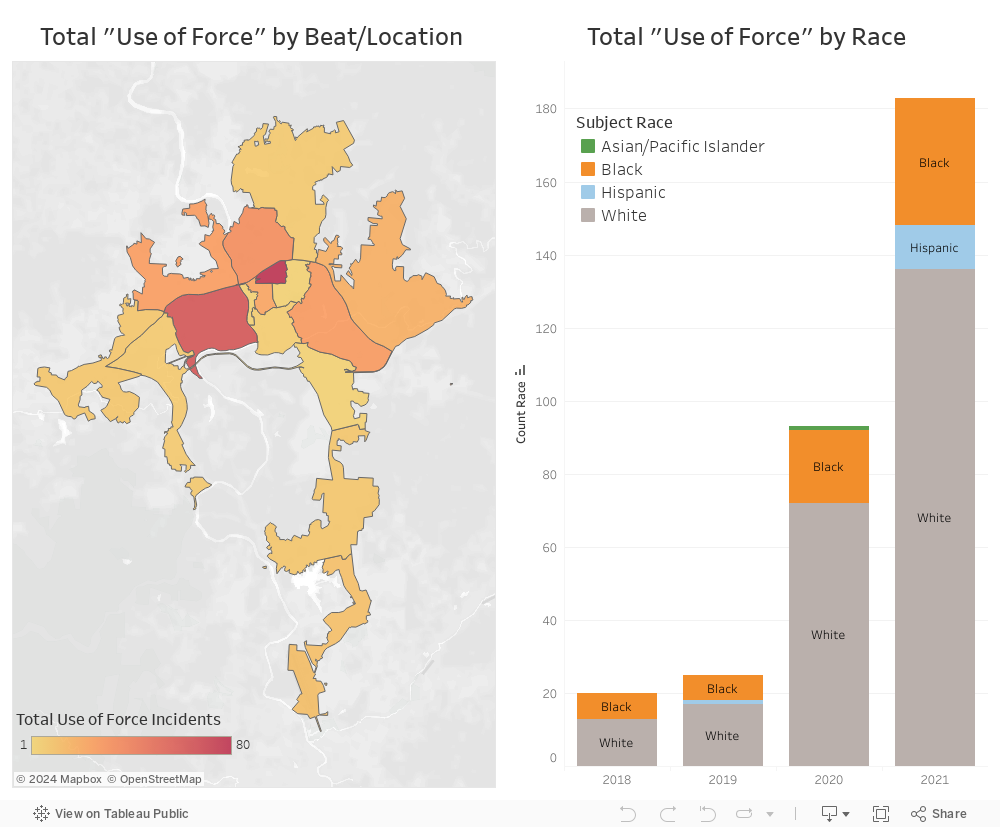
In the first, we've compiled all of the reported "use of force" data from 2018 to the present into a frequency map, broken down by APD's "beats." In the second, we break down the data by year and the race of the subject. Note that since 2021 is not over, that data is only complete through the first 6 months of the year.
Below the visualizations, we will break down a few key pieces of context.
What is "Use of Force," How are These Reports Collected, and How Have Policy Changes Affected the Data?
On June 9th of 2020, 9 days after APD used teargas and "pepperballs" on protesters assembled on the Jeff Bowen Bridge in the wake of the murder of George Floyd, Police Chief David Zack addressed City Council and said the department had been "underreporting" use of force. He said they would expand their definition of "force" to bring those numbers more in line with reality. These policy changes are at least partially responsible for the jump from 27 incidents in 2019 to nearly 200 incidents in the first 6 months of 2021.
Asheville Police Department's website provides the following definition of "use of force:"
"Any physical strike, instrumental contact with a person, or any physical contact that restricts the movement of a person and does not include the application of handcuffs with no resistance."
The policy manual related to the use of force, which was last updated in October of 2020, is publicly available. "Force" is not defined outright in this document, but it does detail the policies of the department with regards to when police are supposed to use force and how they are to report such incidents. It heavily relies on the phrase "objectively reasonable" to determine the appropriateness of an incident.
The policy provides the following definition for "objectively reasonable:"
"The reasonableness of a particular use of force based on the totality of the circumstances known by an officer at the time of the use of force. Circumstances may include but are not limited to: the seriousness of the crime, the level of threat or resistance presented by the subject, and the danger to the community."
It is worth noting that of all the incidents in the first half of 2021, not a single one was found "unjustified."
Is the Data Really "Open"?
Collecting this data and contextualizing it in any meaningful way was much harder than the city's "Open Data" efforts would nominally suggest. To make the visualizations above, we had to compile three separate datasets which used different column names and were riddled with typos. We initially pulled more data than we could use at present, as it will require extensive manual correction due to differences and errors in spelling.
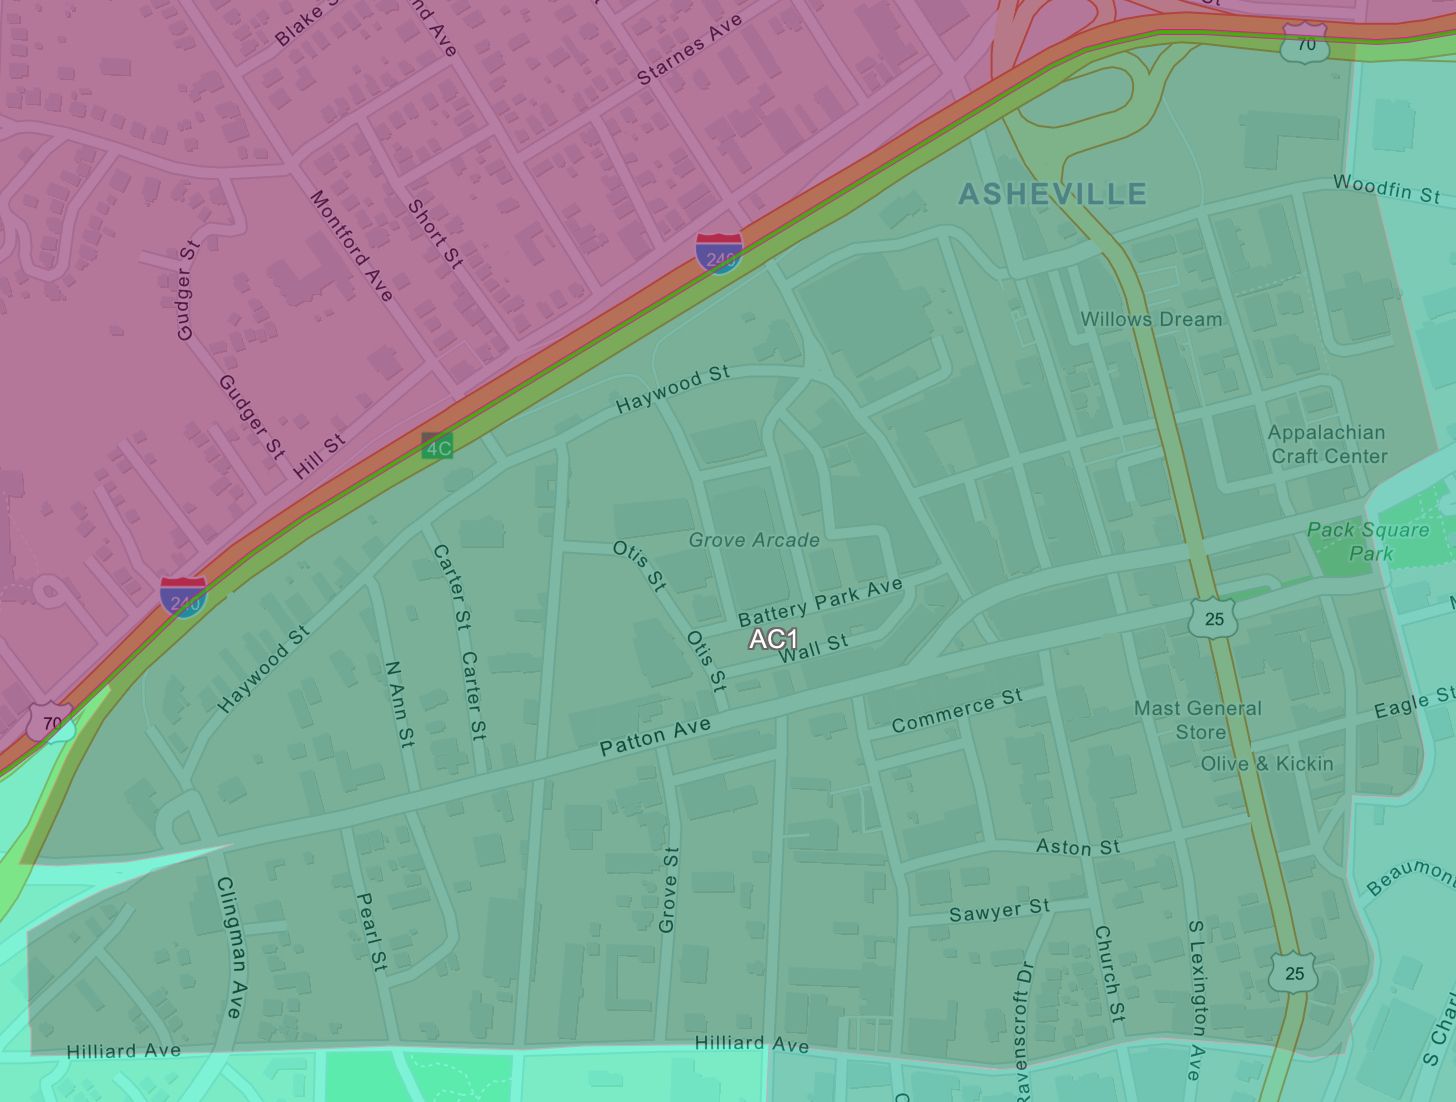
The data also lacks key information that would make it more understandable to the general public. For example, while the "Use of Force" incidents contain a "beat" code (called "county_location" or "district/beat" in different datasets), these "beat" codes - which look something like AB2 - are completely opaque unless compared with the police's "beat map." We could find no way to make this comparison within the City's data portal.
What Does the Data Show?
There is a clear racial disparity shown in the data. Despite only making up around 13% of the population in Asheville, Black people were subject to nearly 20% of APD's use of force in the first half of 2021. When including "Show of Force" incidents, where an officer brandishes a weapon at a subject, that number increases to nearly 25%.
According to the data, Beats AC1 and AA4 were the two areas with the highest number of use of force incidents from 2018 to the present. AC1, a downtown beat, is one of the smallest areas but contained the largest number of incidents: 80.
AA4 is the West Asheville beat, which is significantly larger and contains the second-highest number of incidents with 63.
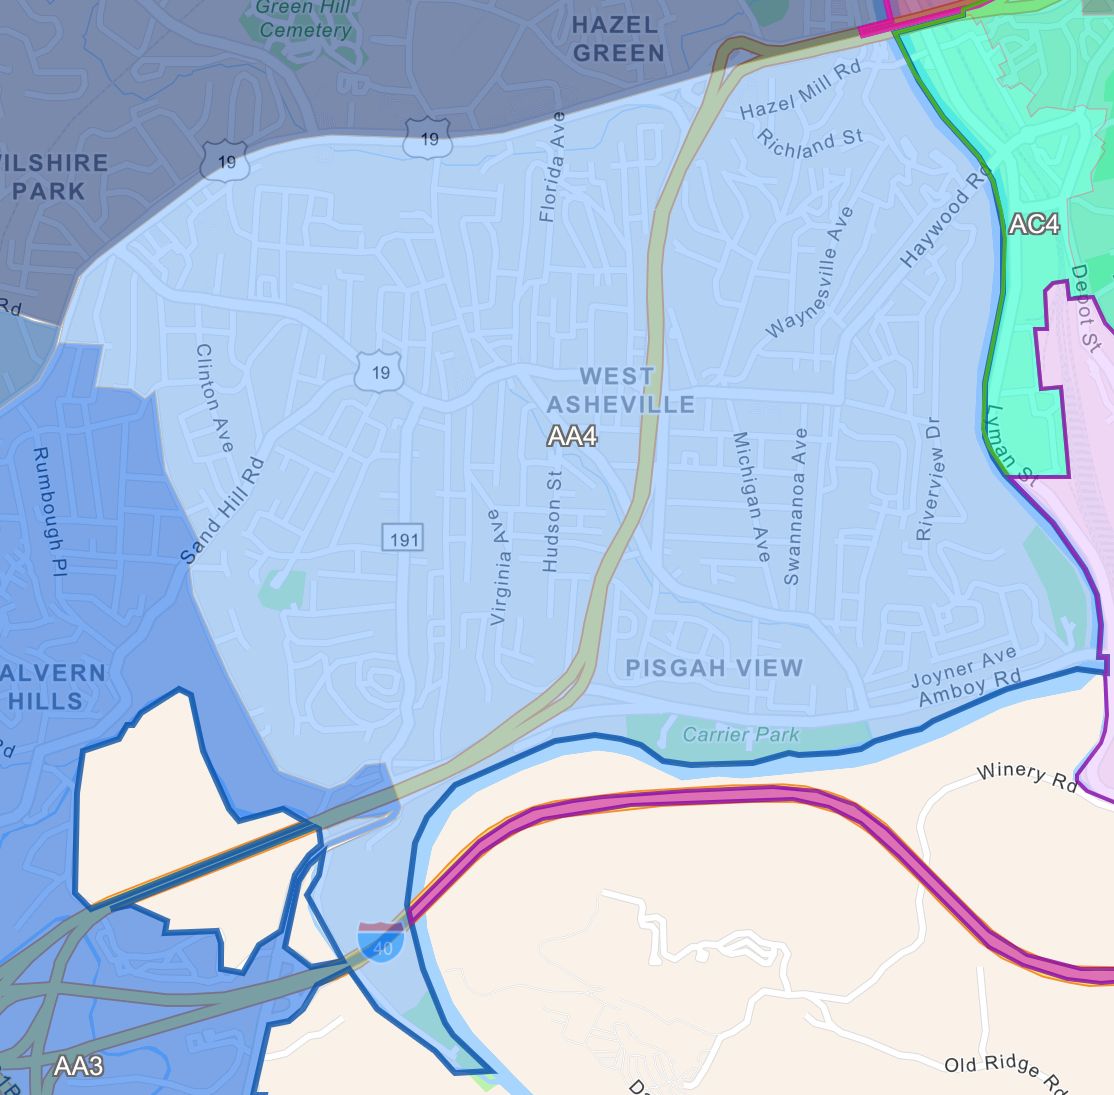
These beats do not map onto census tracts, and the exact rationale behind their size and shape is currently unclear. Therefore it is difficult to make accurate extrapolations beyond noting the raw numbers and their locations. The Free Press has reached out to APD's Public Information Officer, Christina Hallingse, with questions regarding the rationale behind these beats, but she did not respond as of publication.
Data and Journalism
At the Asheville Free Press, we believe that data can be an incredibly valuable tool but can also be misleading if not properly contextualized and analyzed. In particular, police data is notoriously misleading - and sometimes patently false - as it comes directly from the police department and is not verified by any third party.
We are committed to providing an accurate and critical perspective on the city's "Open Data" efforts, and doing so will be an ongoing project. We will publish periodic analysis on this data as we gather, clean, compile, visualize and contextualize it. We plan to launch our own dashboards that we hope community members will find useful. What do you think of these efforts, is there any particular data you'd like to see visualized or analyzed? Let us know by sending us an email: Editor@AshevilleFreePress.com.
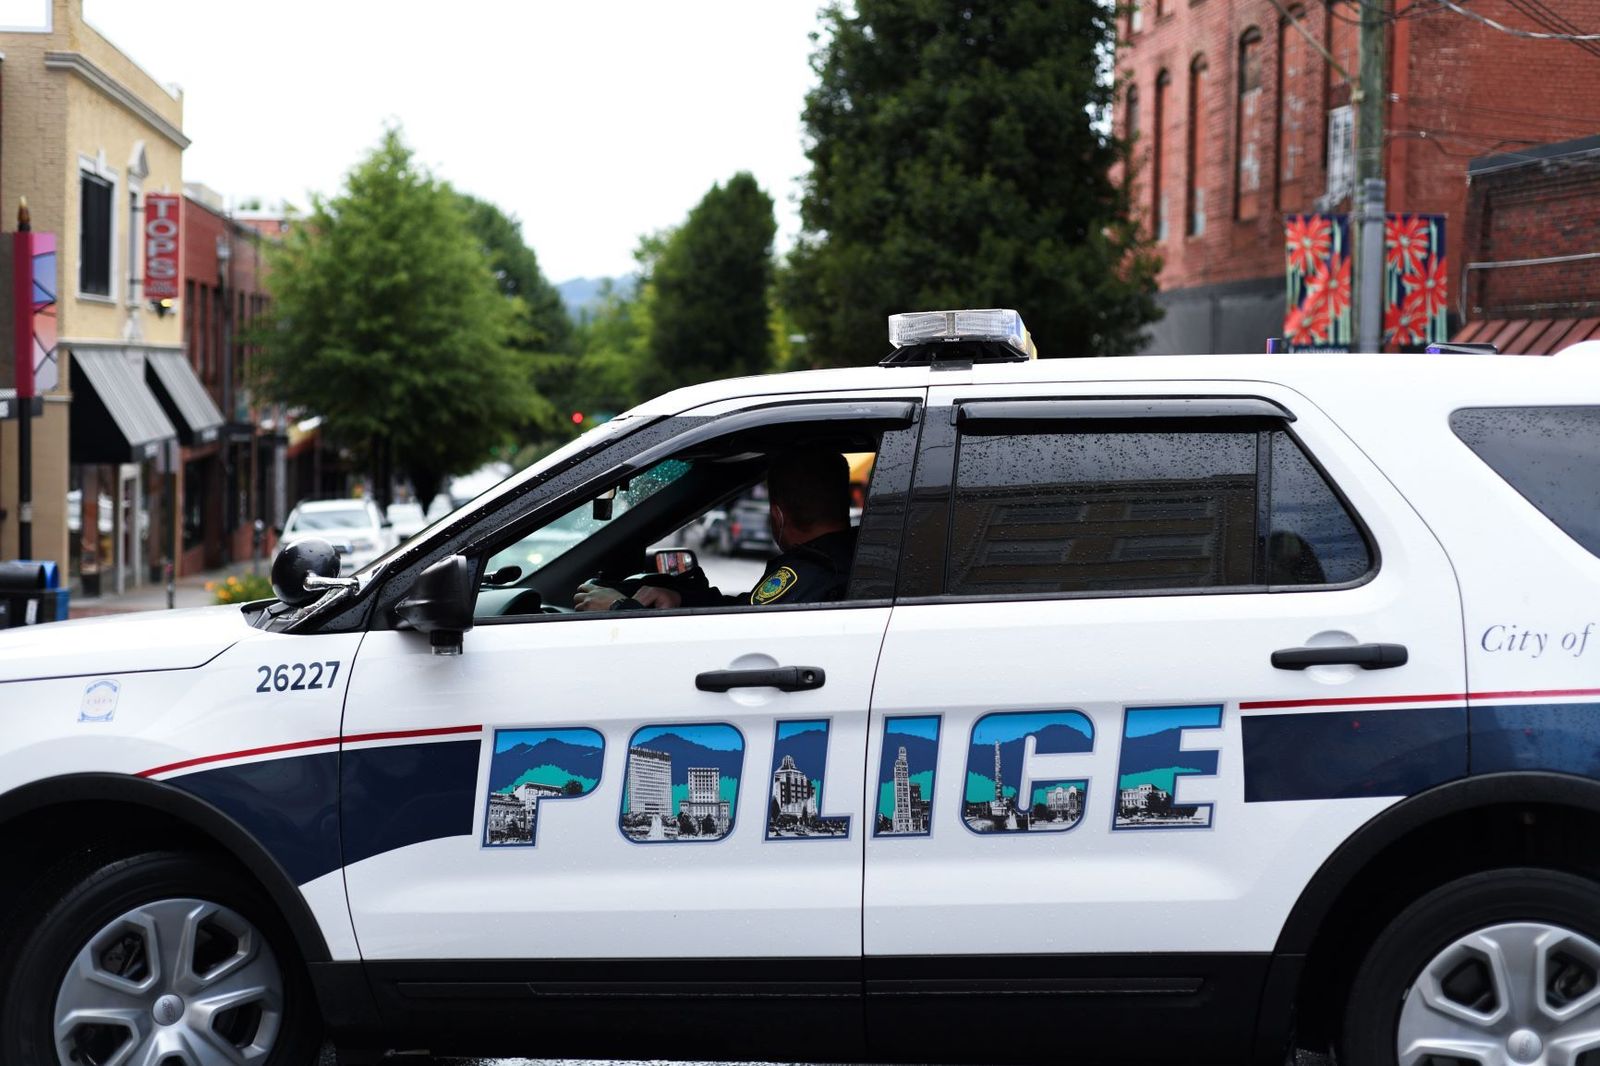
Words by Ursula Wren, Data Science by Elliot Patterson, Photography by Orion Solstice.
We are 100% funded by community members like you. If you like what you just read, help us make more like it by becoming a patron.
Become a Patron!